Data Models: More than just a picture
A data model is often perceived to be a set of diagrams (entity relationship diagrams or ERDs) representing the data elements within a given scope, together with the rules and constraints that relate and govern them. These elements are further described in a supporting data dictionary.
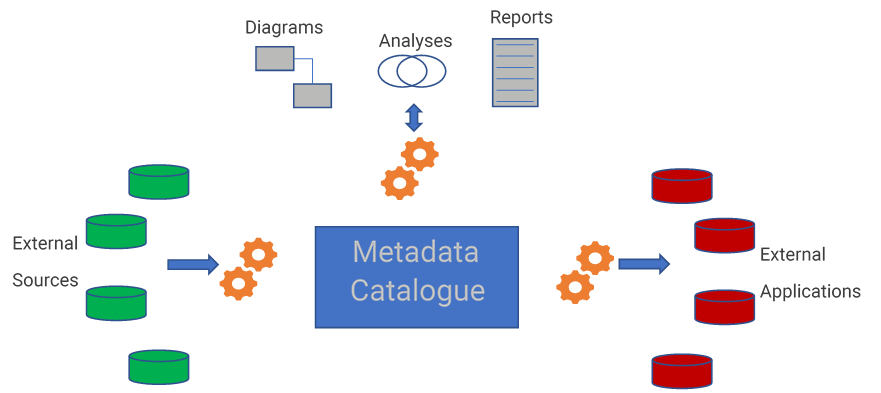
In reality, it is the underlying catalogue of metadata constituting this data dictionary that forms the basis of the model, with the diagrams being visualisations of the structures described there.
Diagrams, analyses and reports are critical to any model, providing the primary interface to the metadata for its users. However, modelling tools rely on a set of transformations to represent and interpret those UI objects as well as to collect metadata from external sources, and to present metadata in appropriate formats for external application.
erwin Data Modeler ticks all of these boxes:
- Diagrams can be used to create, update and visualise metadata from the catalogue. They can be configured to meet the content and layout requirements of the many different scopes and perspectives of their varied audiences
- Reports and analyses can be generated from the catalogue using the in-built Report Designer, SQL Queries or the open API.
- It has powerful reverse engineering (RE) capabilities to collect metadata from a wide range of database technologies
- The forward engineering (FE) capabilities not only transform metadata back into Data Definition Language (DDL) scripts for creation or update of database structures, but also facilitate generation of custom text-based files.
So, far from being a simple collection of data structure diagrams, each erwin data model is a metadata catalogue supporting collection, communication and reuse of complex metadata.
Check out our “erwin Data Modeler in 8 Minutes” video here
Have a look at erwin’s blog What Is Data Modeling?